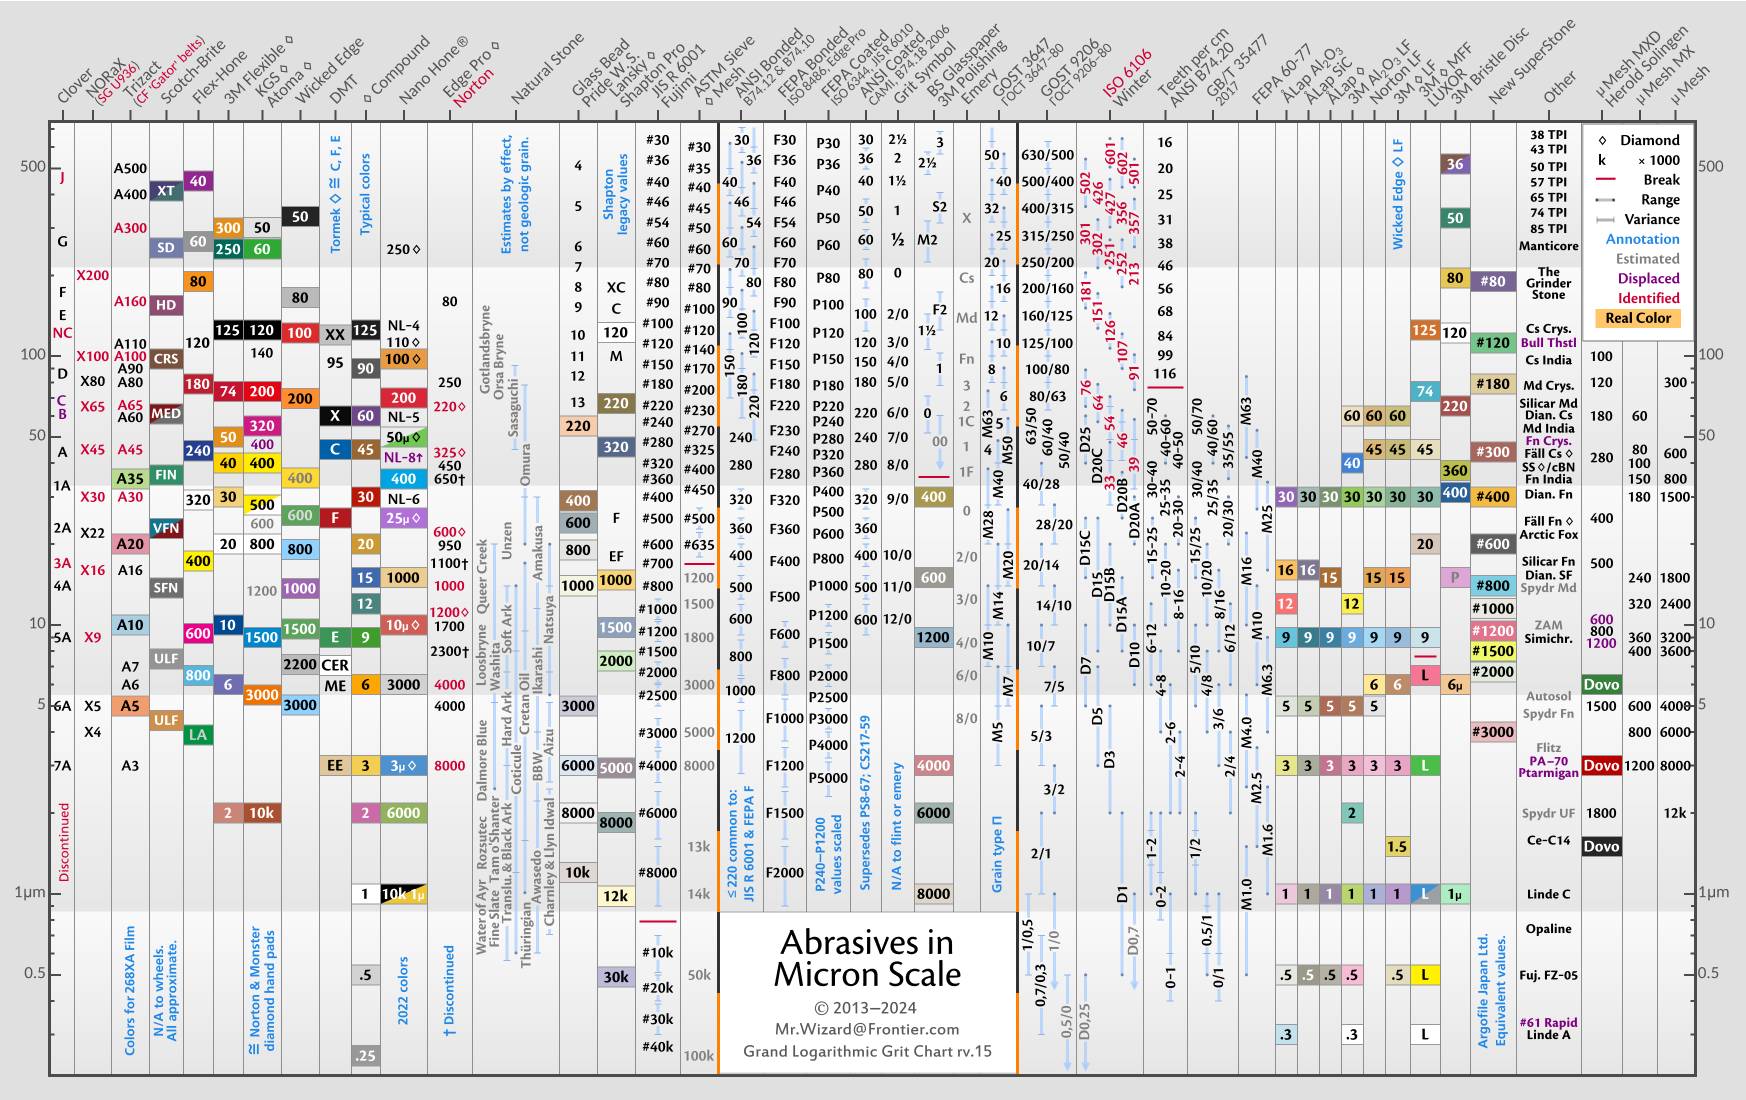
Abrasives in Micron Scale: Grand Logarithmic Grit Chart
I would like to present a new format of grit comparison chart. In the chart I seek to display the information as compactly and intelligibly as possible. Since abrasive particles sizes cover several orders of magnitude a logarithmic scale is most appropriate. A logarithmic scale also has the property of equidistant spacing for any geometric progression, meaning that a theoretically ideal stone series will be uniformly spaced in the chart. Stated another way, two grits that differ by a specific ratio will be a specific distance apart on the vertical axis of the chart whether they are 1.0 and 1.5 micron or 200 and 300 micron.
I give tribute those before me who created unified grit charts which were my inspiration for creating this one. Please see the README for ongoing acknowledgements.
I spent considerable time assembling this chart therefore I am not releasing it into the public domain. I retain control over its distribution and use as detailed in the README and LICENSE files. I ask that it only be shared by linking to the original source: http://myplace.frontier.com/~mr.wizard/GLGC/
The chart and README will be updated if and when corrections or improvements are appropriate. Previous versions as well as additional charts may be made available in the /GLGC/ directory.
I am soliciting feedback on the chart presented above. Any corrections and all suggestions are welcome.
Please ask any questions you have regarding the chart and its interpretation. Anything that is unclear shall be additionally explained in the README, and potentially modified in future revisions.
As explained in the README file I chose to limit the range of the chart to keep it compact. A format I considered is to include additional scales to cover the macrogit and submicron ranges. Please see the file “GLGC RC2.png” in the directory linked above. I request feedback on this layout as well.
I already responded to your chart on KKF, so I’ll keep it brief here. But praise again :cheer: .
On KKF you wrote that Clay provided you the figures for the WEPS stones. Is there a reason the WEPS diamond stones are at about their expected micron rating, but not exactly? (E.g. 1000 grit stones at around 7.)
Thanks for the blog link; I hadn’t seen that and it looks very interesting. I suppose ceramic values are always approximate/equivalent based on what I read (elsewhere) about that Spyderco rods. I should note that in the README with the next revision.
Have you looked into how these equivalents compare to a standard mesh size? Or is the ANSI value the equivalent of a standard mesh size? One of the others?
I use a chart on http://www.advancedabrasives.com/index.cfm?page=sap-diamond-powders From this, I extrapolate a simple, not-so-sophisticated formula: Divide 20,300 by micron size or grit size to get the opposite value: (Micron size = 20,300/grit) or (Grit = 20,300/Micron size). Am I plucking daisies in right field?
Thank you for your interest. “Mesh” is a bit confusing and ambiguous, at least from what I have seen. It is a specification for a wire sieve, notMesh (scale) abrasive grit. (And there is more than one.) If you have a spec of x wires per inch you also have to ask how thick the wires are if you want to know how big the holes are; it is not simply a fixed ratio. Additionally it becomes mechanically infeasible to use mesh grading for very fine grits therefore the high mesh numbers are merely theoretical. A summary of some different mesh types from Wikipedia: . Note that none of them extend beyond 500.
Then you have to ask what you mean by a mesh number applied to a grit. Does it mean all of the grit passes through that mesh (sieve)? Or the grit will caught on that mesh? How much of it will be caught? Essentially mesh (sieve) is used in the grading and testing of grits, specifically macrogrits, but it is not itself a grit standard. (And individual macrogrit standards use mesh differently.) For coarse grits it may be used that way in a highly approximate sense or simply as jargon (e.g. referring to ANSI 120 grit as “120 mesh”). With finer grits it seems to be used in marketing to give extremely high numbers that look impressive; I suppose “100,000 mesh” looks more impressive than 0.25 micron to uneducated eyes. (I believe the page you referenced is simply using 25,400 microns per inch divided by “mesh” for their equivalents.)
I chose to include U.S. Mesh up to 400 in my chart because it physically exists and therefore serves a purpose. As is the case with all of the data in the chart (please see the README) you cannot directly convert from one column to another. (Or as is the case with a dual-family column like US Mesh / Chosera, from one family to another.)
By the way do you find the alternate form with extended scales shown here of value?
Clay Allison, I note that you have seen my chart. I hope you like it. I used the values from your chart for the Chosera stones. Could you tell me more about these numbers? While neither 5000 nor 10000 is part of the JIS standard these two Chosera values do not match an extrapolation from JIS 1998. If the values were provided to you was their nature further specified or merely “micron?”
I was thinking again about the grit rating for ceramic stones. You’ve read my blog post, so you know about the difficulties.
What we want to measure (I think) is abrasiveness of stones. For diamond stones and water stones we have found a measurement for this: the size of the abrasive particles.
However, for ceramic stones this doesn’t work. Still, we try to plot them on the particle size scale in order to denote their abrasiveness. This seems like a methodological problem to me.
What do you think about this? (I have no solution at hand…)
Yes, I did read your blog post. It’s the best treatment of the issue I have yet seen; well done.
I decided early in the process that my chart would not attempt to make absolute comparisons if abrasive performance. This is clearly explained in the README.
[ol]
[li]As you well know diamond compound on leather cuts much more slowly and produces a much higher surface finish than the same diamonds on a metal plate. This means that even if the abrasive and the work piece are identical results can be very different.[/li]
[li]If the type of abrasive is different the results with further diverge; a soft but sharp abrasive may work very fast on soft metal yet be ineffective on high hardness steel.[/li]
[li]Abrasive roughness (sharpness) plays a large role in performance that particle size distributions do not quantify.[/li]
[li]The shape (aspect ratio) of abrasive particles is not well addressed in the standards, yet again can have a large impact on performance.[/li]
[li]Even for a specific abrasive material of a specific particle shape and roughness and a specific median particle size by weight (D50) performance may be different. This is because a single number cannot describe the entire distribution including maximum particle size etc. An abrasive may be more tightly graded than a given standard and yet still comply with it.[/li]
[/ol]
So where does that leave us? In my opinion there is still value in a chart like this or I wouldn’t have spent so long putting it together. However I think that is is more useful for considering spacing within a family of products than absolute comparison between them.
Generally I have avoided inclusion of abrasive products that have to be quantified by approximate performance rather than actual PSD values. There are only a couple of exceptions, one of them being the Wicked Edge ceramic rods. I included them partly because a rough micron grade had already been assigned to them (on Clay Allison’s chart) and partly because they were part of a series. If their relative performance to each other, and to a limited degree their performance relative to the WEPS stock plates, can be reasonably approximated then I think their inclusion will be of service to WEPS users.
I am open to other ideas for how this chart may be further developed but I hope the concerns outlined above sufficiently explain my current position on the matter.
My background come from the paper industry, but I think the same principles apply. Mesh size has to do with the size of the openings or perforations. The size of the wire or other intermediate material is not considered. Screens are rated by opening size and the total percent of opening. You could have a screen with an array of 1/4" holes and a total open area of only 20%. I don’t know how or if abrasive particles can be sieved down to micron size, but the equivalents would apply. Running the particles through a series of attrition mills, each with an eventual exit opening dimension would take them down to the target diameter - that which would pass through an equivalent sieve. The sequence and mill type would also contribute to particle roughness.
I’m sure that grit size is extrapolated from the particle size, which can be measured by microscopic and ESM methods. A batch of particles measured to have a median size of 0.5 microns would be assumed to pass through a sieve opening 1/50,000 of an inch wide, for 50,000 grit. Grit size is apparently the inverse of the particle size in inches.
Edit: To be correct, from the chart at the Advanced Abrasives site, particle size is the metric inverse of “mesh”, which I read to be particle diameters per inch.
The readme file indeed provides a good list of reasons why particle size does not equal abrasiveness. One thing you might want to add to that is the speed at which the abrasive particles break down. For example, these particles seem to break down pretty fast in Chosera stones, which produces a mud. I think this is why Choseras have much more of a polishing effect than, for example, Shaptons.
This idea of the unified grit comparison chart has definitely taken a more serious turn! :woohoo: Nice job, Mr. Wizard!
The Chosera grit to micron ratings were modeled after the JIS new chart, IIRC. which, in my experience, lines up pretty well with the way they are situated hereKnife Forums. Komit also did one on a while back, too.
One of the things to remember -which has already diligently been addressed here- is that the micron ratings, while the most tangible of all the variables, are really only a loose quantification of abrasive size. I love that Mr. Wizard has addressed the idea that particle size does not correlate to the depth of its scratches, something we touched on a couple of years ago on this forum with the 14 micron diamond paste vs. a 1K diamond - and warrants more discussion. B) I also love that PSD, shape, density, and friability are also mentioned as variables. Time, pressure and effects of the binders are also worth mentioning, too! It is all these entropic forces that make us fall back on the micron or grit rating. So, in that respect, everything looks to be in good relative order on the chart. B)
On a personal level, I think these charts are important, but can quickly become overwhelming since the grit range has been greatly expanded to 0.025 microns now. One thing I would like to address based on my own findings is that the 5K Chosera should be rated slightly below the 5K Shapton Pro…
Top is a 5K Chosera, and below is a 5K Shapton Pro, but even then, in the hands of other users, the results will inevitably vary!
Tom, I’m glad you like it, and thank you. Please make sure to look at the linked README file. I gave specific acknowledgement to Komitadjie as his chart was the primary inspiration for mine. With the v0.81 update the README mentions these factors of abrasive performance, among others:
backing or bonding characteristics
cutting point density (open vs. closed coat, binder proportion etc.)
workpiece composition and hardness
pressure and speed of application (affecting grit penetration depth)
I appreciate the pragmatic note regarding Shapton vs Chosera 5K performance, but as explained I will not be modifying item placement in my chart based on that kind of observation unless it amounts to overwhelming evidence that the datum is false.
I would love to see a chart comparing the absolute performance of many different abrasive products but such an endeavor would be far beyond my budget, if nothing else. I have given it thought however. My best idea is creating several standard steel samples, cutting them into pieces, and sending them to the four corners of the sharpening world. Contributors would then perform specific operations under instrumentation (spring scale, chronometer, etc.) and mail the samples to a lab for surface roughness measurements. Somewhere in the process the samples would need to be weighed on a calibrated lab balance to measure total metal removed. This is probably far too involved and costly to be worth it to most people.
My questions are in the area of the high grit sandpapers. I am using a combination of papers from 3M that I guess are ANSI, and I found some 2500/3000 grit paper from an auto detail supply company locally. My results are good and consistent and the progression is smooth but on the charts it seems there is now way it could line up.
For example my P2500 paper is much much finer then a 600-800 ANSI paper from 3M. The 3000 grit is so smooth it feels like vellum or something…any help greatly appreciated.
Also did the Wicked Edge 5u/3.5u pastes make the chart? I usually follow up the 3000 grit paper with these and have had near mirror polish results to the naked eye.
Thanks again for all you work on compiling this!!! B)
You’re welcome! It took a lot of work to get to this point.
The ANSI column in the chart is for loose or bonded abrasives like stones rather than coated abrasives like sandpaper. According to http://www.uama.org/Abrasives101/101Standards.html there is also apparently an ANSI coated standard (“ANSI B74.18-1996, currently under revision”) but I was unable to include it in the chart. (This is noted in the README; please do take the time to read that file.)
I would not be so quick to assume “ANSI coated” for sandpaper as I have not seen product clearly specified in that standard. I have seen products clearly specified in JIS, FEPA-P, and CAMI; I believe Norton makes all three if I recall correctly. According to the charts on the page linked above the elusive ANSI coated values seem to line up quite well with JIS 1998, though tightness of grading is not identical, so if you do actually have ANSI coated paper you could look at those values for a rough guide.
The P2500 paper is clearly marked so among the three samples I think it is the best to use as a reference. I shall guess that your 600/800 3M paper is CAMI graded. This would put it as noticeably coarser than P2500. If the difference still seems larger than expected look closely at both products: a (semi) open coat will feel coarser than a closed coat and also leave a rougher finish. If that still cannot explain your observations please take a picture of the backs of your 600/800 sheets and I will see what I can find.
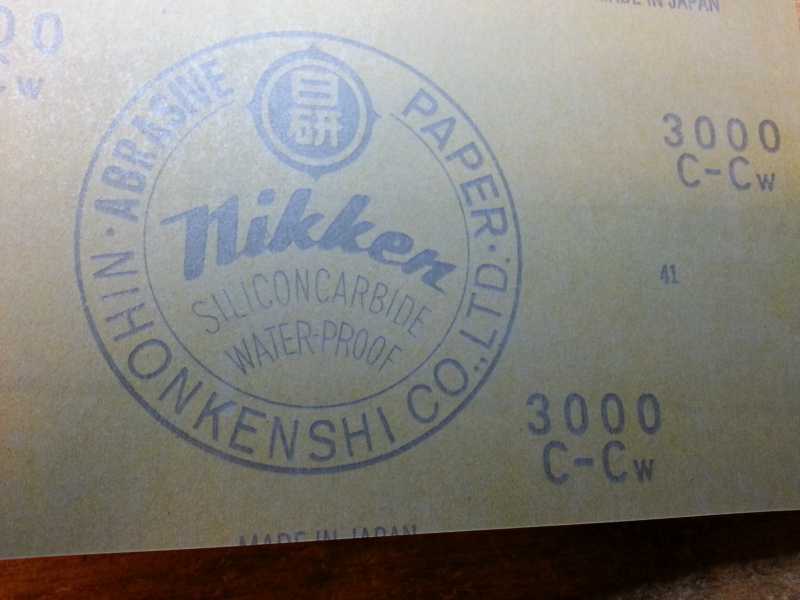
The Nikken 3000 paper is quite likely J3000 as it is made in Japan. This would make it a good choice to follow P2500, all else being equal. (But please note the discussion above; an average particle size alone is in no way sufficient to determine abrasive performance.)
The 3M 2000 is the hardest to figure out. I have repeatedly looked for clear documentation from 3M and not found it for this product. I did find micron equivalents for their Wetordry™ Polishing Paper and included them in the chart. Perhaps working together we can figure out what is most likely. Does your 3M 2000 paper appear to be coarser than both the Nikken P2500 and “3000” paper that you have?
The “Diamond compound” column in my chart is not based on the Wicked Edge pastes. Rather it is based on the coloration of diamond compound from a number of supplies which seem to be in at least partial agreement. (This also is stated and further detailed in the README.) The Wicked Edge pastes are clearly marked, as are the strops I believe, so it seems less useful to catalog those. My hope is that the compound colors on my chart give a “best guess” for a diamond compound that is unmarked or has had the label obliterated.
As you probably are aware the speed and finish from a compound greatly depends upon the applicator used, with harder substrates causing the particles to cut deeper into the workpiece. You can see from http://www.wickededgeusa.com/grits-comparison-chart-for-the-wicked-edge-sharpener/ that the 14 micron diamond compound on leather gives a completely different finish from 14 micron stones; it has polish far beyond its apparent grit size.
I did some searching and find that there are a bunch of different grit definitions. There’s the Federation of European Producers of Abrasives (FEPA) which has definitions for both paper and solid abrasives. When you see paper with a “P” designation (ex.: P1800) that’s the FEPA paper standard. There’s also the ANSI standard. Some use the maximum size of any particles in a batch to define the batch size, or they may use the average particle size. None seem to have their charts go beyond 1000 grit, which seems to be the finest you can run through a sieve. For smaller particle sizes, I think they just grind away at a batch until it visually seems on average to meet the standard they are looking for.
I misspoke (?) earlier when I said that the grit number is the inverse of the particle size in inches. It’s more correct to call it the reciprocal of the particle size in inches.
For example: A 3 micron particle size would work out to 0.0001181 in inches. The reciprocal is 8,467, or about 8500 grit.
According to the chart by Advanced Abrasives, you could find 3 micron particles in anything between 6,500 and 11,000 mesh. Grits of 6,500 could have particles ranging between 3 and 5 microns, while grits of 11,000 could have particles ranging from 1 to 3 microns.
I’d infer that this could be one of the reasons why we see large differences in the scratch patterns of various forms of abrasive media. To-may-to, to-mah-to. So, just how red are your tomatoes?
Maybe there’s some guy in the quality lab, looking down a microscope, saying “Yup. There’s some big ones and some little ones, but overall, this batch looks like 3 micron to me. Let’s call it 8,000 grit and sell it to Norton”
As an old friend would say, “Machts nichts.” For our purposes, it doesn’t matter, but now I think I know what the numbers are supposed to mean.
tcmeyer, is your reply primarily to Cliff Curry or to me? I shall respond as though you were addressing me.
Yes, “P” grades are FEPA-P, as shown in the chart. The acronym FEPA is also defined in the README. I did not feel it was necessary to say “when you see ‘Pxxx’ it means FEPA-P” as that seems tacit. Do you disagree?
Regarding ANSI please see my post above and also the README. There is apparently an ANSI coated standard that goes to 8000 and is nearly identical to JIS, but I have been unable to find a free reference and since the standard is “under revision” I don’t feel like paying for an obsolete technical document. From the UAMA link above:
[color color=#ff0000]Caveat: the UAMA graphics below use JIS 1987 rather than the newer 1998 revision, and FEPA 1993 revision rather than the newer 2006.[/color]
“ANSI B74.18-1996 (shown as ‘Coated’ in the exhibits)”
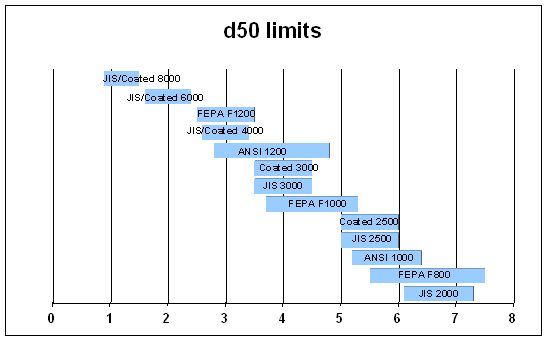
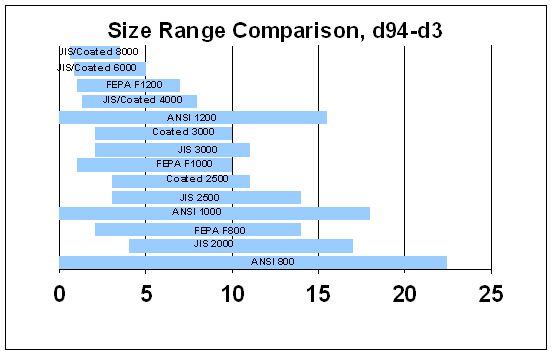
Note that at higher values JIS and “Coated” are co-labeled and apparently equivalent. However D50 values are not the only specification in a grit standard; it is not sufficient for a grit to be nominally 3 micron as you describe. Also from the UAMA page we have the D3 and D94 limits for certain grits:
Note that (ANSI) “Coated” appears to be more tightly graded than JIS at lower grits and far more tightly graded than ANSI B74.10. (Incidentally JIS is considerably tighter than FEPA-P, not shown.) At higher grits JIS and ANSI coated are again co-labeled.
Thank you for the reply, I will have to slow way down and take the time to read more thoroughly(especially the readme!) It is really a lot of information to take in at once, and I got a bit excited to see in black and white what has been a huge mystery to me since I started.
You have already clears up many of the questions I have had for a long time. These are the grits currently available/used by me in progression after the 1000 grit diamond paddles:
p1000 ≈ 20µ
p1200 ≈ 16µ
p1500 ≈ 13µ
3M 1500 - ? (feels a bit smoother then p1500)
3M 2000 - ?
p2500 ≈ 9µ
3000 ≈ 4µ (if it’s the “J” type which it does seem to be)
The J3000 does perform well following the P2500. A large part of my excitement was in the new Micro ceramics, and micron sprays that are in route. Im looking forward to extending my limits downward further and the chart is already proving invaluable as a guide.
The 3M products do seem to be the missing piece for this area. Strange since it seems to be widely available. The 3M 2000 does feel slightly more course the P2500. The P1500 definitely feels more course the the 3M1500 but question if it could be open/closed coat differences etc. I agree the 3M information is elusive, I did find a woodworking website that said, “1000 to 2500 grits are made from 3M’s 401Q Silicon Carbide abrasive paper – graded in the ANSI/CAMI grit scale.” Not very helpful since isnt that 2 scales?
Please let me know what needs further clarification. It will help me improve the README.
3M 411-Q.pdfI think I found the woodworking page you referenced. I have seen similar statements before, sometimes contradictory. I have yet to see a proper specification in an official 3M publication. Based on your descriptions and a bit more digging I think that 3M is using ANSI B74.18-84 (ANSI coated), not yet on my chart. I cannot find this in any English publication from 3M but I did find a few references in Spanish documents, e.g.: . There is no guarantee that this is used in their other products but it does align with what you are observing. If I am correct the 3M 1500 should very similar to P2500 but (perhaps) graded more tightly.
Status_of_Standards_2013-09-05_ANSIpublic.pdfIncidentally the “84” in ANSI B74.18-84 means 1984 which leaves me wondering why 3M would be using such an old standard. There are 1996 and 2006 revisions of this standard, and even the 2006 one may be under revision if I interpret this correctly: .

